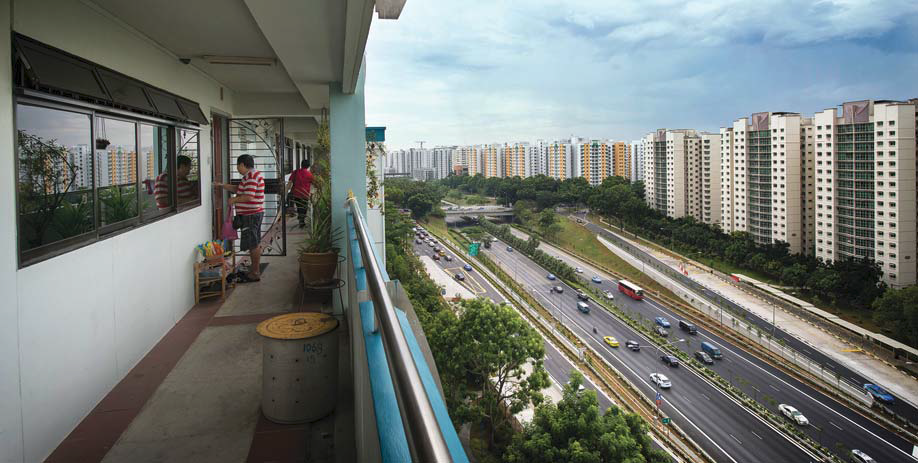
No lack of space for 10 million population
Jan 11, 2014

Year | Population | Land size | Population density (per sq km) |
|---|---|---|---|
1980* | 2,413,945 | 617.9 | 3,907 |
1985 | 2,735,957 | 620.5 | 4,409 |
1990* | 3,047,132 | 633.0 | 4,814 |
1995 | 3,524,506 | 647.5 | 5,443 |
2000* | 4,027,887 | 682.7 | 5,900 |
2005 | 4,265,762 | 696.9 | 6,121 |
2010* | 5,076,732 | 710.4 | 7,146 |
2015 | 5,535,002 | 719.1 | 7,697 |
Notes:
* Census of population
Prior to 2003, data are based on Singapore’s land area as at end-December. From 2003 onwards, data are based on Singapore’s land area as at end-June.
Data on population from 2003 onwards exclude residents who have been away from Singapore for a continuous period of 12 months or longer as at the reference period.
Source: SingStat, Century 21 (IPA)
HDB towns | Land size (Ha) | Flats under
HDB management | Projected ultimate
number of units |
|---|---|---|---|
Ang Mo Kio | 638 | 49,169 | 58,000 |
Bedok | 937 | 60,115 | 79,000 |
Bishan | 690 | 19,664 | 34,000 |
Bukit Batok | 785 | 32,275 | 53,000 |
Bukit Merah | 858 | 51,885 | 68,000 |
Bukit Panjang | 489 | 34,463 | 44,000 |
Choa Chu Kang | 583 | 42,393 | 62,000 |
Clementi | 412 | 25,480 | 39,000 |
Geylang | 678 | 29,256 | 49,000 |
Hougang | 1,309 | 51,646 | 72,000 |
Jurong East | 384 | 23,379 | 30,000 |
Jurong West | 987 | 71,755 | 94,000 |
Kallang/Whampoa | 799 | 35,740 | 57,000 |
Pasir Ris | 601 | 29,207 | 44,000 |
Punggol | 957 | 35,515 | 96,000 |
Queenstown | 694 | 30,546 | 60,000 |
Sembawang | 708 | 20,311 | 65,000 |
Sengkang | 1,055 | 59,497 | 92,000 |
Serangoon | 737 | 21,293 | 30,000 |
Tampines | 1,200 | 66,599 | 110,000 |
Toa Payoh | 556 | 36,439 | 61,000 |
Woodlands | 1,198 | 62,675 | 98,000 |
Yishun | 778 | 56,698 | 84,000 |
Other Estates | - | 22,856 | 25,000 |
Total | 968,856 | 1,504,000 | |
To be built | 535,144 |
Note:
“Toa Payoh” town includes Bidadari
“Other Estates” include Bukit Timah, Central Area and Marine Parade
Land size includes private developments on private and state land.
Projected ultimate figures include private developments under Government Land Sales Programme.
Source: HDB “Key Statistics – HDB Annual Report 2014/15”, Century 21 (IPA)
New residential precincts | Land size (Ha) | Estimated housing units | Estimated start date |
|---|---|---|---|
Paya Lebar Air Base | 800 | 120,000 | 2032 |
Greater Southern Waterfront | 1,000 | 150,000 | 2030 |
Tengah | 700 | 55,000 | 2017 |
Marina South | 60 | 9,000 | 2018 |
Others | n.a. | 200,000 | 2050? |
Note: The estimate for the 9,000 housing units in Marina South is stated on the Urban Redevelopment Authority’s website and the other estimates are based on the author’s estimates based on various sources.
Source: URA, Century 21 (IPA)

